

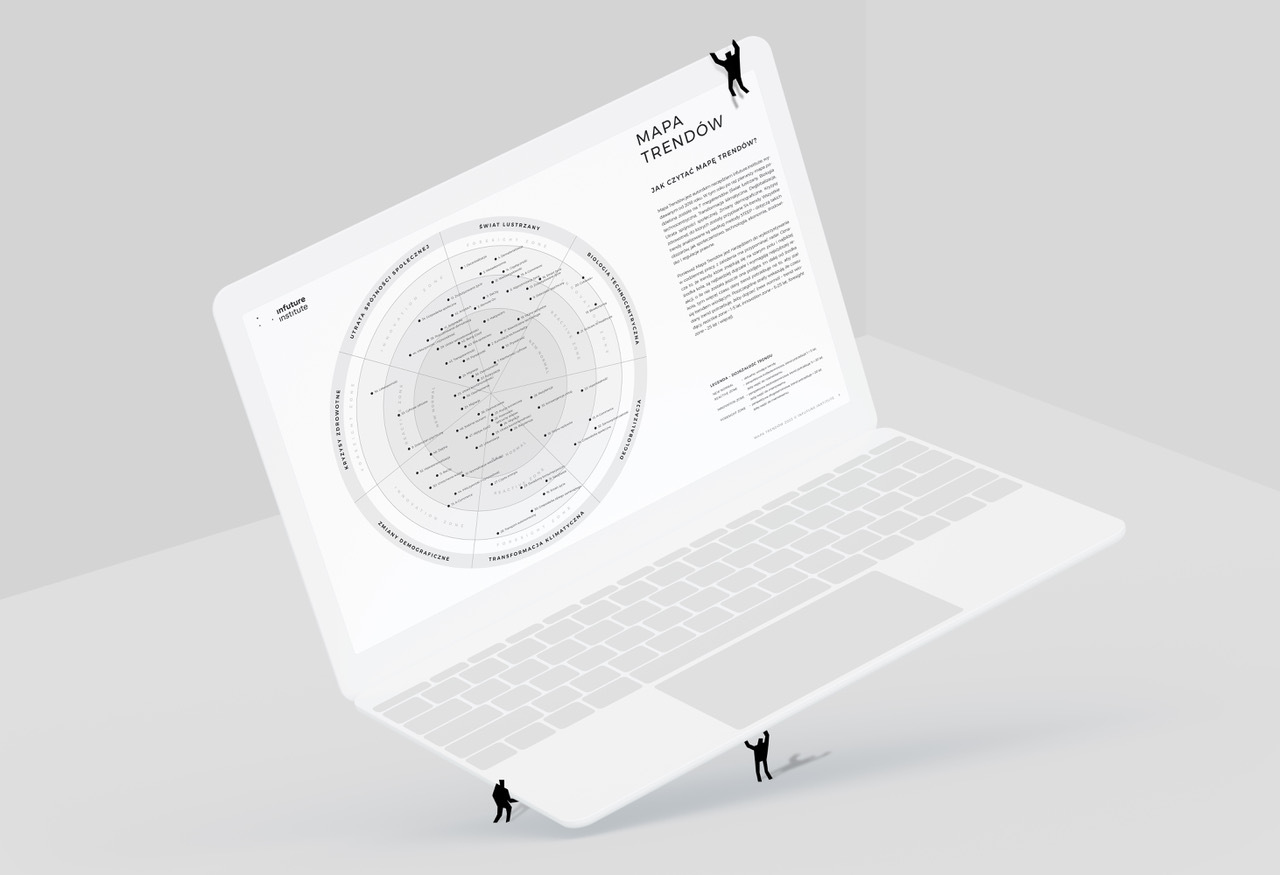
Trend Map 2023
The Trend Map is infuture.institute’s proprietary tool, published annually for the past six years. This year it was divided into 5 megatrends, to which 50 trends were assigned. The map is a comprehensive analysis of all areas of life: society, environment, technology, regulatory, legal and economic changes. The trends on the Map were presented in three different perspectives (including time and correlation between megatrends).
What is the Trend Map?
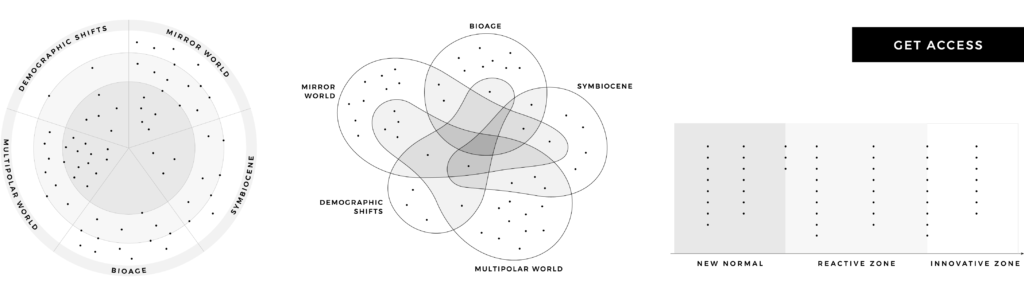
The map is a comprehensive analysis of the most relevant megatrends and trends presented in three time perspectives: new normal (currently leading trends), reactive zone (short-term perspective, the trend needs 1 > 5 years to become a leading trend), innovation zone (medium-term perspective, the trend needs 5 > 20 years to become a leading trend). The Map allows you to understand the challenges of the future in the context of megatrends, trends, identify key factors and supporting technologies.
How to work with the Trend Map?
The Trend Map is a tool for use in the strategic or operational work of companies and organisations. Due to the time division used (new normal, reactive zone, innovation zone), on the one hand, it allows the future to be mapped and indicates the development directions, and on the other hand, it makes it possible to identify the areas to be most urgently addressed.
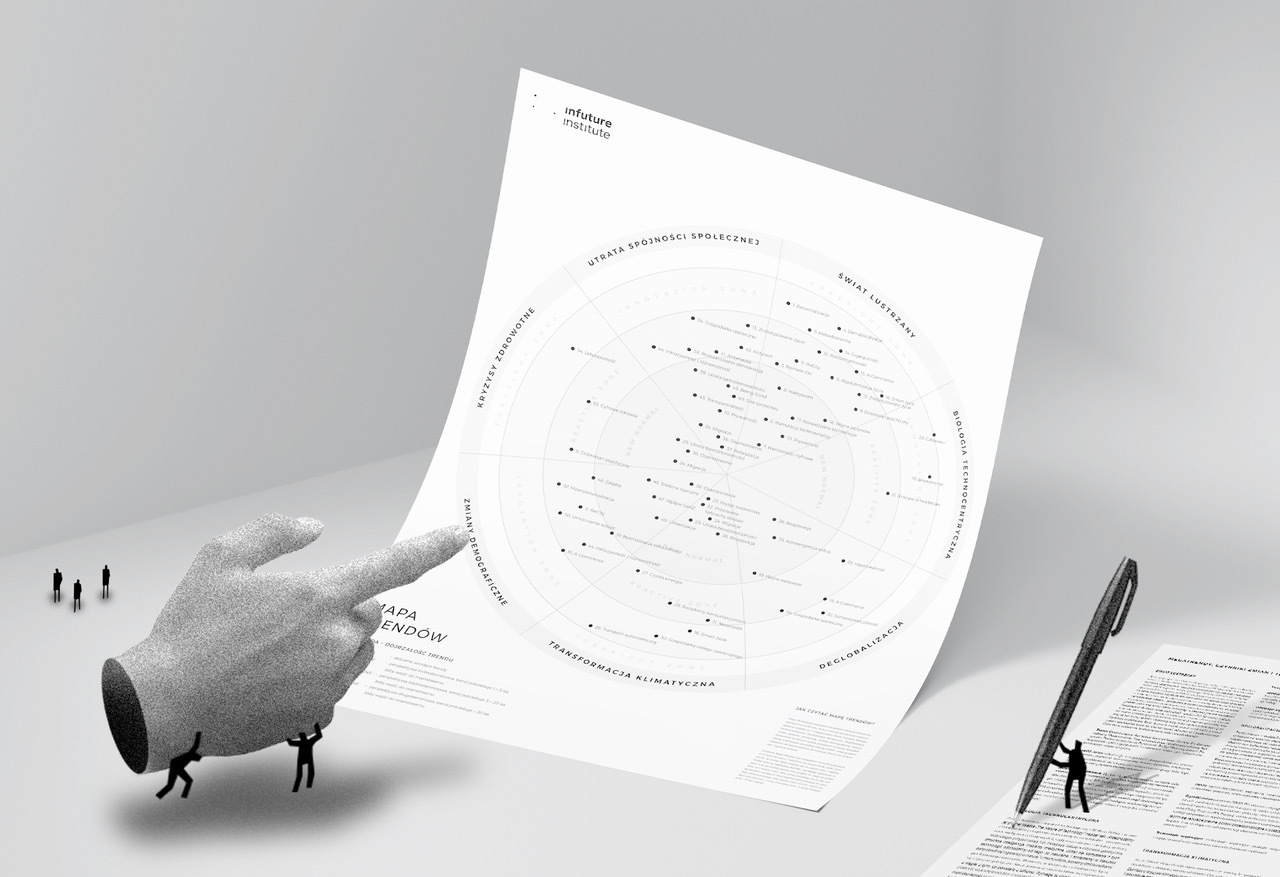
The Trend Map is built like a radar and should be viewed as such. The trends that are closest to the middle are the leading trends – so if a company has not yet addressed them in any way, it means that it is probably not keeping up sufficiently – either with the market, the competition or consumers. Trends that are in the reactive zone are worth taking into account, especially when working on a strategy that, by design, has a 3-5 year perspective. Trends in the innovation zone, due to their greater time distance (more than 5 years), have less impact on daily operational work – but are worth observing in the context of how the world is changing; something to keep an eye on.
The Trend Map is also divided into two layers in the substantive area: a general layer and a detailed layer. The detailed layer consists of 50 trends, which have been assigned to five megatrends (general layer). This allows working with trends on two levels. Megatrends (Mirror World, Bioage, Symbiocene, Demographic Shifts, Multipolar World) show the main directions in which the world is developing, while trends within megatrends allow the challenges of a particular megatrend to be addressed in an easier and more precise way.
Main conclusions
1. There are fifty trends on this year’s Trend Map, of which nearly thirty are new. Most trends fell within megatrends such as the Mirror World and the Multipolar World, which vividly illustrates the direction in which our world is currently changing – intense technological development, progressive digitalisation and polarisation.
2. The trends that reoccur within the largest number of megatrends, indicating their strength, are: Mental Wellbeing (occurs within four megatrends) and Loneliness (within 3 megatrends).
3. This year, the Trend Map has been developed in two additional perspectives: a time-based perspective (see p. 3), which makes it easy to analyse trends within individual time zones (new normal, reactive zone, innovation zone); and a perspective that shows the correlation between megatrends and trends, their interaction with each other (see Venn diagram).
Trend map over time and Venn diagram are available for logged in users.
4. Looking at the time perspective of the Trend Map, it is clear that most trends are in the reactive zone – which is natural in a way, as it is the most important zone in terms of developing a strategy for the future; addressing these trends allows you to take on the role of an innovator.
5. Looking at the relations between trends and megatrends (Venn diagram, p. 4), it can be observed that the megatrend that overlaps with the largest number of other megatrends is the Mirror World. Interestingly, in the new normal zone, this megatrend overlaps with the megatrend Multipolar World, but in the innovation zone, it mostly overlaps with the Bioage megatrend. This shows how progressive digitalisation is changing our world – currently, it is primarily changing socio-political life, eventually, it will also be changing life on a biological level.
The Trend Map is a tool for use in the strategic or operational work of companies and organisations. Due to the time division used (new normal, reactive zone, innovation zone), on the one hand, it allows the future to be mapped and indicates the development directions, and on the other hand, it makes it possible to identify the areas to be most urgently addressed.
The Trend Map is built like a radar and should be viewed as such. The trends that are closest to the middle are the leading trends – so if a company has not yet addressed them in any way, it means that it is probably not keeping up sufficiently – either with the market, the competition or consumers. Trends that are in the reactive zone are worth taking into account, especially when working on a strategy that, by design, has a 3-5 year perspective. Trends in the innovation zone, due to their greater time distance (more than 5 years), have less impact on daily operational work – but are worth observing in the context of how the world is changing; something to keep an eye on.
The Trend Map is also divided into two layers in the substantive area: a general layer and a detailed layer. The detailed layer consists of 50 trends, which have been assigned to five megatrends (general layer). This allows working with trends on two levels. Megatrends (Mirror World, Bioage, Symbiocene, Demographic Shifts, Multipolar World) show the main directions in which the world is developing, while trends within megatrends allow the challenges of a particular megatrend to be addressed in an easier and more precise way.
- What are the consequences of trends on your business?
- Which ones need to be addressed today?
- How to translate trends into specific solutions?
- Which ideas are most commercially sound?
Access the Trends Map:
Attention! The Interactive Trend Map is available only in the desktop version.
Trends Map
onlineTrend map 2023 in three models and definitions of all megatrends and trends – Desktop version.
Trends Map
printable ver. 39 złOnline and printable version of the Trends Map. Useful in everyday work. Allows you to add your own notes. Useful visual material for workshops and strategic meetings.
Trends Map
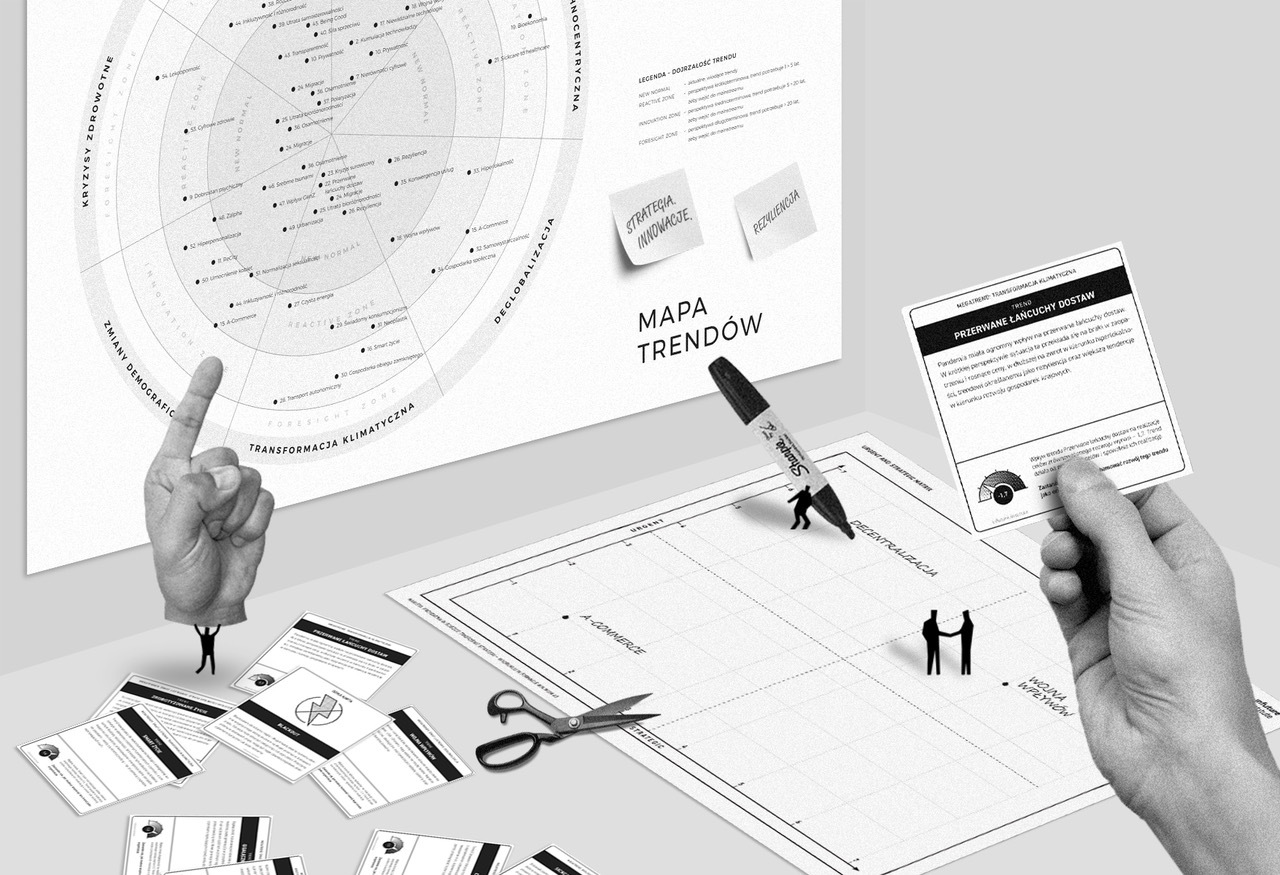
printable ver. 39 EUR 34,5 EURTrend Cards
printable ver. 39 EUR 34,5 EUROnline and printed version of the Trend Map with Trend Cards attached. Useful during workshop work. Included set of exercises makes it easier and faster to translate trends into solutions.
Trend workshops with infuture.institute
- What are the consequences of trends on your business?
- Which ones need to be addressed today?
- How to translate trends into specific solutions?
- Which ideas are most commercially sound?
Meet us at the Trend Screening workshops, where we will help your organisation to systematise trend knowledge, prepare a development strategy and develop specific business solutions.